What is Demand Curve?
Demand Curve is the line graph of the amount of a product that buyers will purchase at different prices. The curve shows the number of units the market will buy in a given time period at different prices.
Understanding Demand Curve
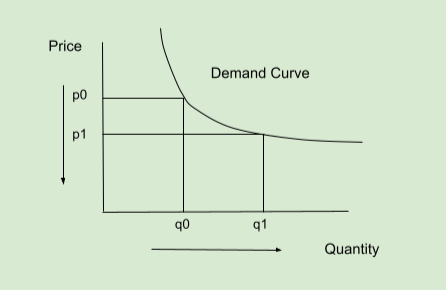
The demand curve represents the percentage change in the price of a particular product or service and the quantity demanded over time. The graph will display the price on the vertical line, and the quantity demanded on the horizontal line. The relationship between the price charged and the resulting demand level is shown in the demand curve.
The curve will shift from left to right, expressing the rule of demand - when the price of a particular product rises, so does the amount required as everything else remains constant.

As indicated in the picture, the price is on the vertical (y) axis, while the quantity is on the horizontal (x) axis. The usual relationship between price and quantity is illustrated in this graph. Demand rises when prices fall. As the price decreases from p0 to p1, the quantity decreases from q0 to q1.
The Law of Demand
This correlation enforces the rule of demand, which indicates that when the price rises, the quantity demanded decreases, all else remaining constant. As long as the four demand determinants remain constant, the relationship between quantity and price must reflect the demand curve. These are the determinants:
- Price of related goods or services
- Income of the buyer
- Preferences of the buyer
- Expectations of the buyer
Practical Example
If the price of Noodles decreases how would this affect the demand curve? As consumers can stock the noodles for a long period of time, the decreasing price would cause a massive increase in the demanded quantity of noodles. Generally, when price drops, consumers tend to buy more products to save money. The same thing happened in this example. If the price goes down from 4 to 2 dollars, the demand may rise from 10 to 14 packets. Hence, the demand curve will shift from left to right.
In Sentences
- In economics, the demand curve is a line graph that depicts how many quantities of a commodity will be consumed at different pricing.
- Demand curves are used to specify the price-quantity connection.
